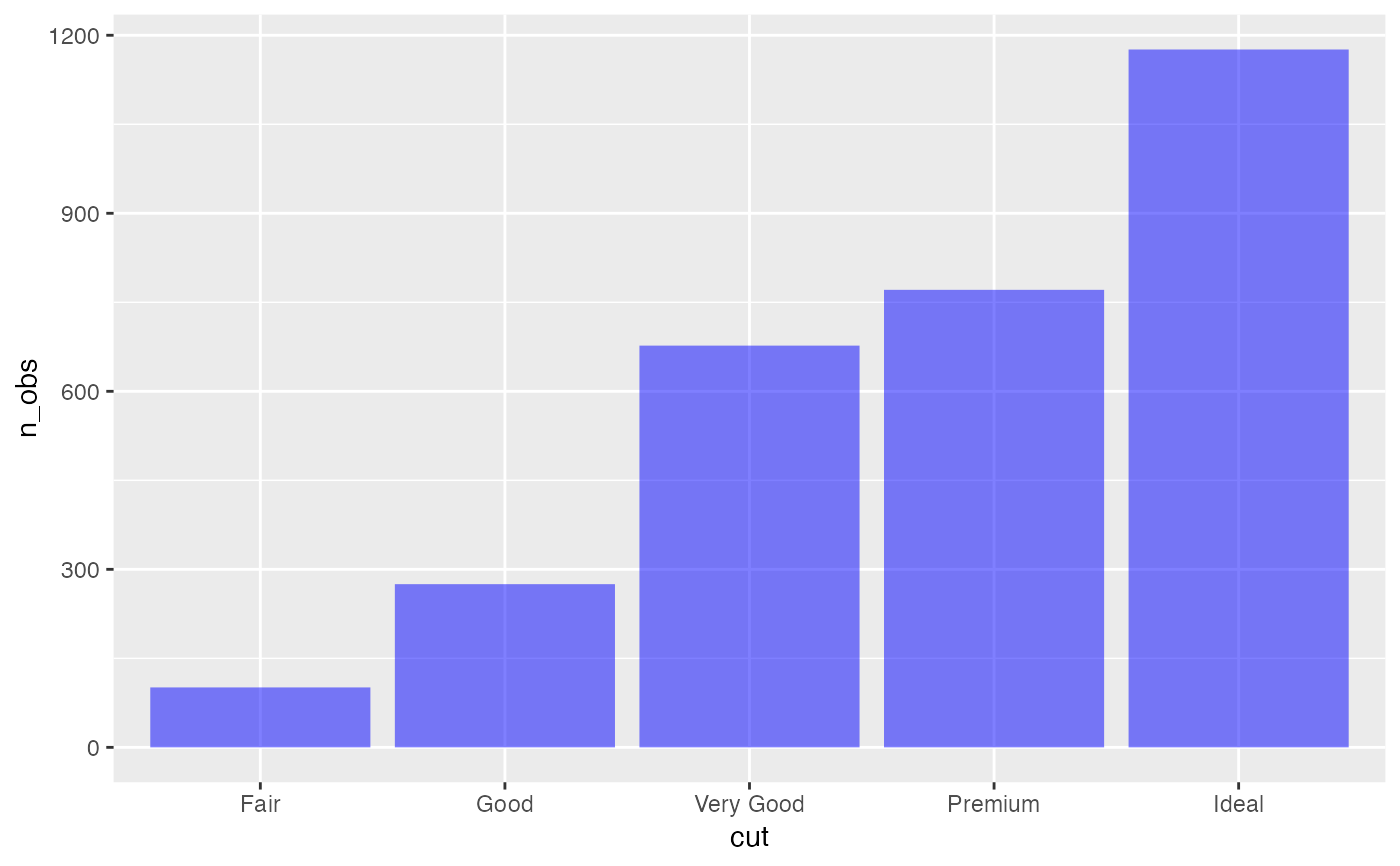
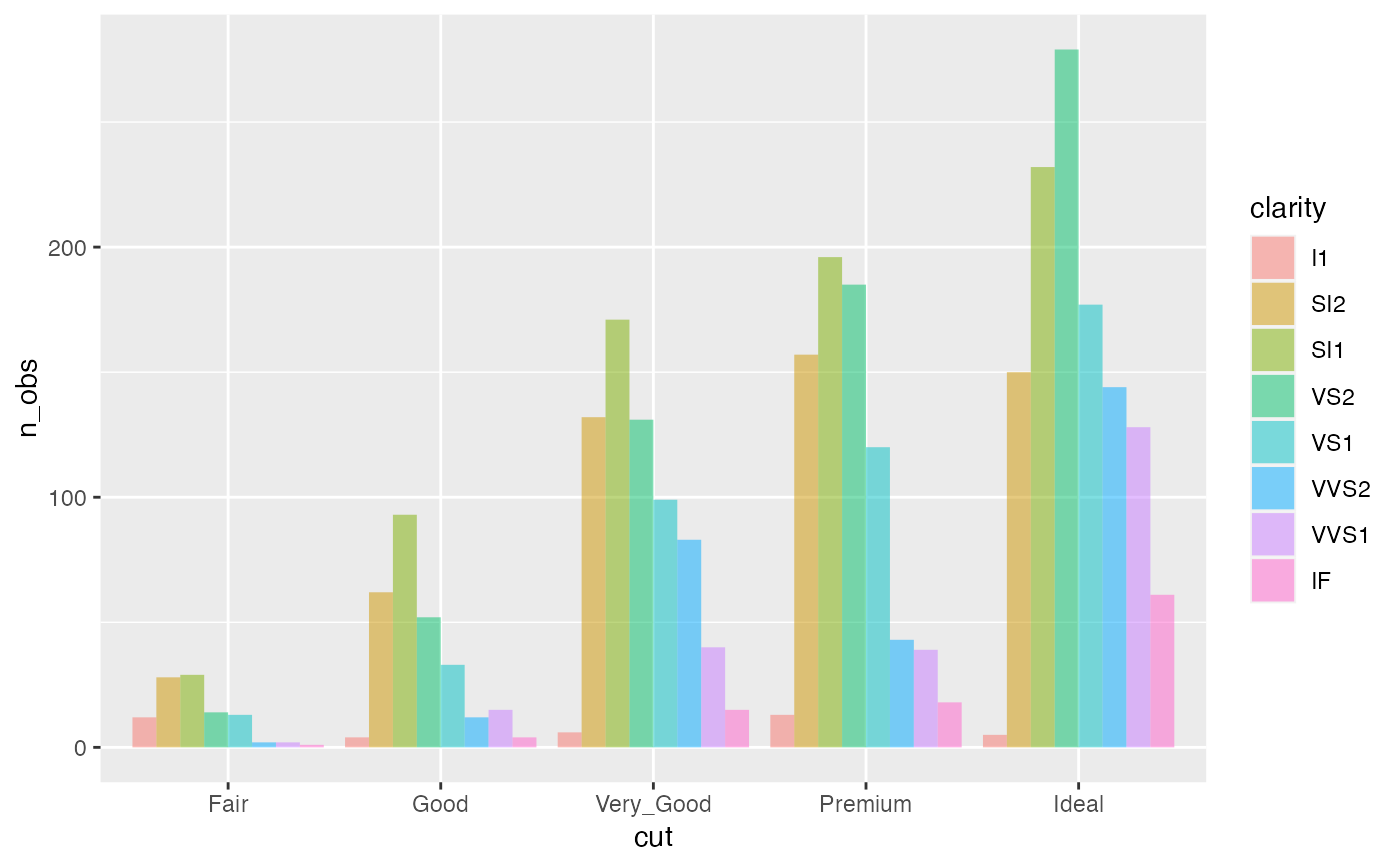
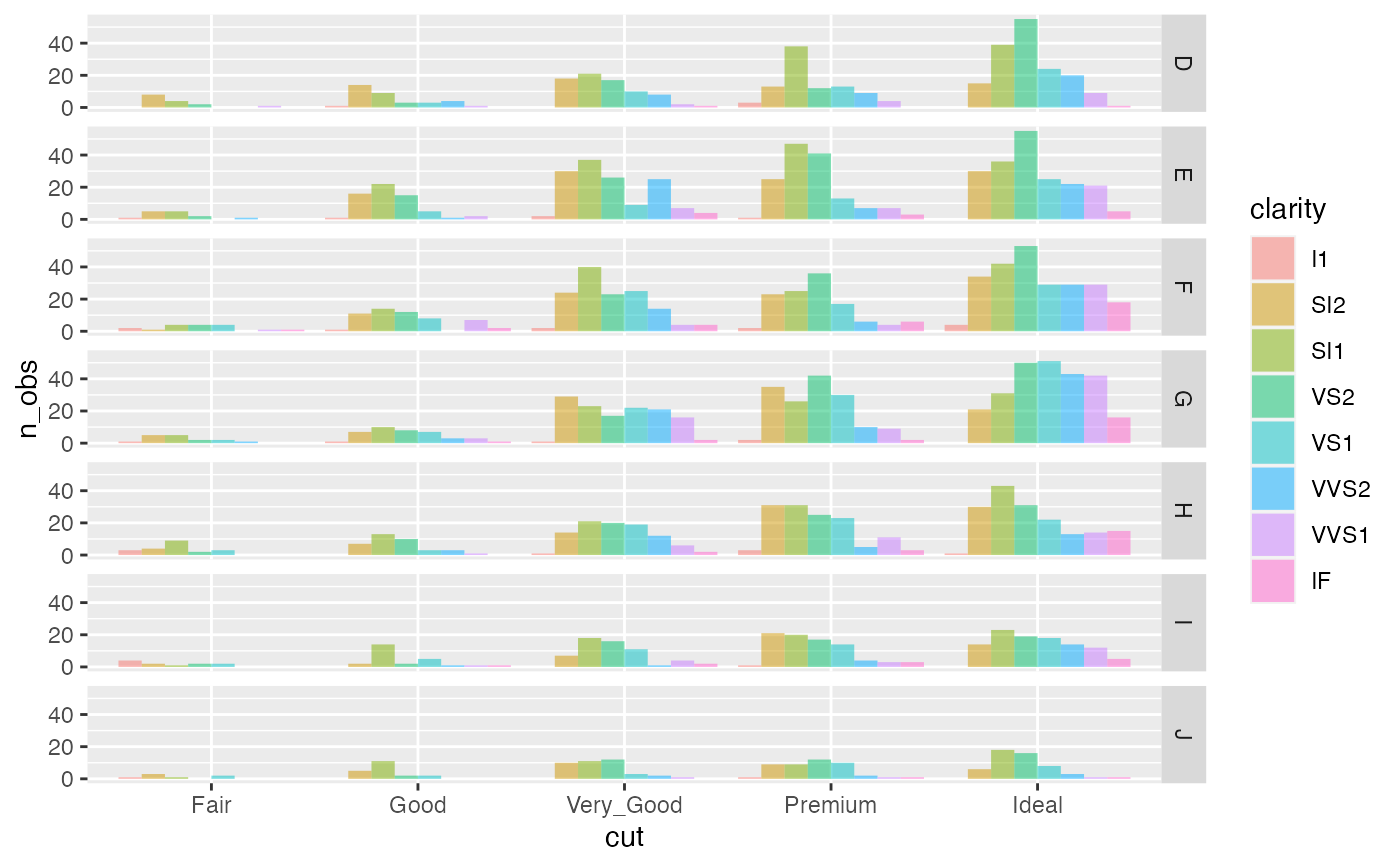
Plot method for the pivotr function
# S3 method for pivotr
plot(
  x,
  type = "dodge",
  perc = FALSE,
  flip = FALSE,
  fillcol = "blue",
  opacity = 0.5,
  ...
)
Arguments
- x
Return value from
pivotr- type
Plot type to use ("fill" or "dodge" (default))
- perc
Use percentage on the y-axis
- flip
Flip the axes in a plot (FALSE or TRUE)
- fillcol
Fill color for bar-plot when only one categorical variable has been selected (default is "blue")
- opacity
Opacity for plot elements (0 to 1)
- ...
further arguments passed to or from other methods
Details
See https://radiant-rstats.github.io/docs/data/pivotr for an example in Radiant
See also
pivotr to generate summaries
summary.pivotr to show summaries