> How correlated are the variables in the data?
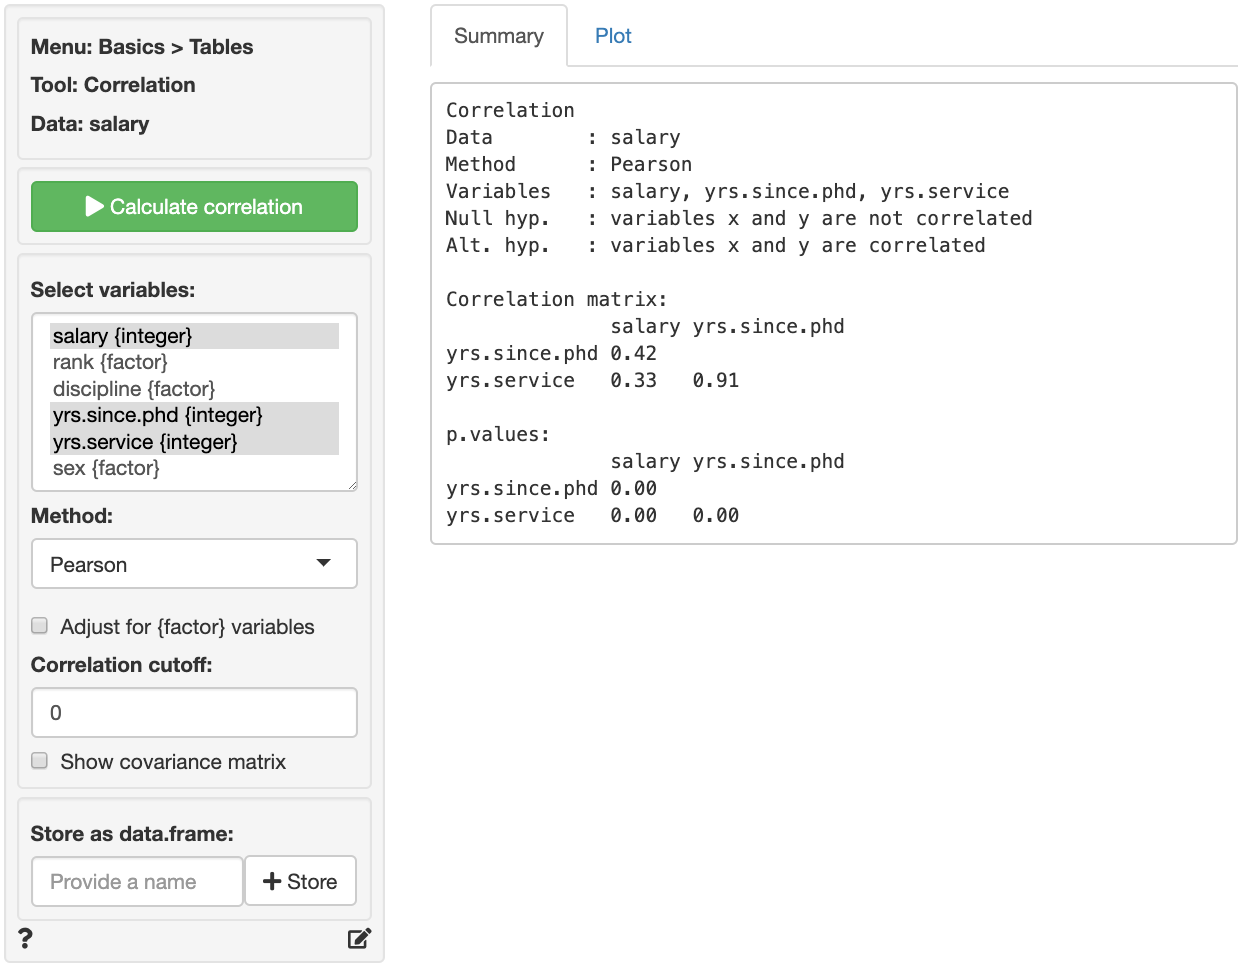
Create a correlation matrix of the selected variables. Correlations and p.values are provided for each variable pair. To show only those correlations above a certain (absolute) level, use the correlation cutoff box.
Note: Correlations can be calculated for variables of type `numeric`, `integer`, `date`, and `factor`. When variables of type factor are included the `Adjust for {factor} variables` box should be checked. When correlations are estimated with adjustment, variables that are of type `factor` will be treated as (ordinal) categorical variables and all other variables will be treated as continuous.
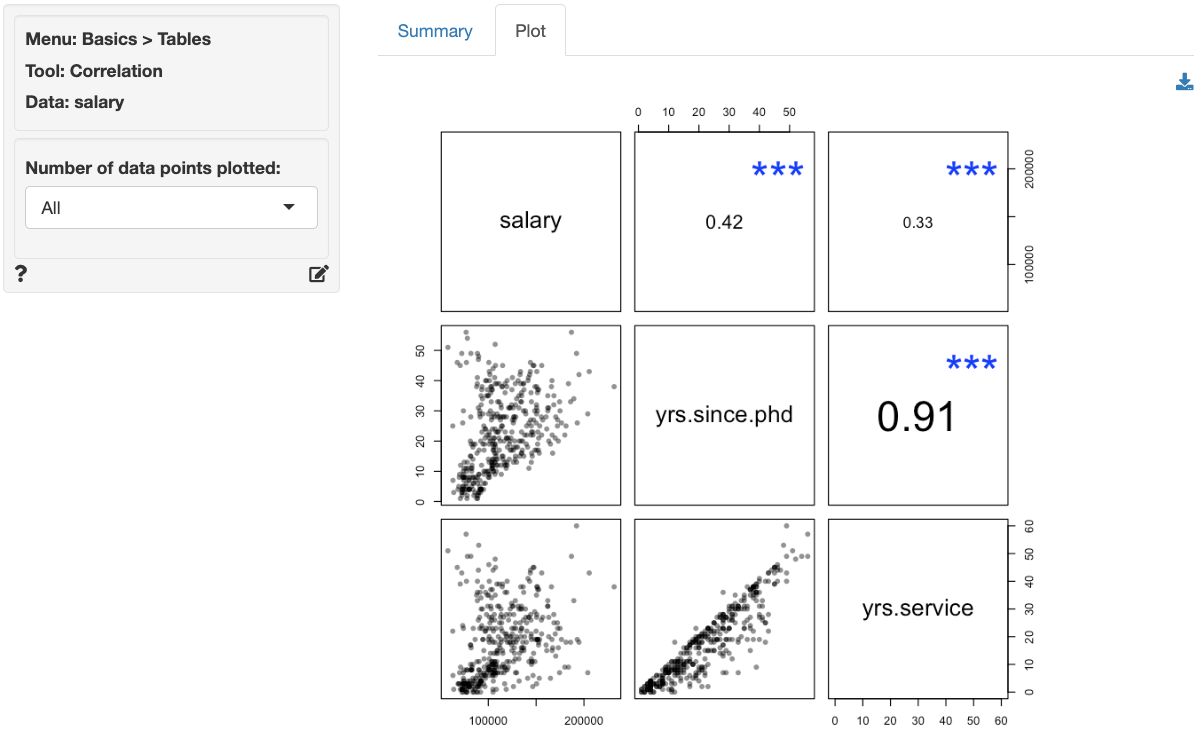
A visual representation of the correlation matrix is provided in the _Plot_ tab. Note that scatter plots in the graph at most 1,000 data points by default. To generate scatter plots that use all observations use `plot(result, n = -1)` in _Report > Rmd_.
Stars shown in the _Plot_ tab are interpreted as:
- p.value between 0 and 0.001: ***
- p.value between 0.001 and 0.01: **
- p.value between 0.01 and 0.05: *
- p.value between 0.05 and 0.1: .
The font-size used in the plot is proportional to the size and significance of the correlation between two variables.
### Method
Select the method to use to calculate correlations. The most common method is `Pearson`. See Wikipedia for details.
### Correlation cutoff
To show only correlations above a certain value choose a non-zero value in the numeric input between 0 and 1 (e.g., 0.15).
### Covariance matrix
Although we generally use the correlation matrix, you can also show the covariance matrix by checking the `Show covariance matrix` box.
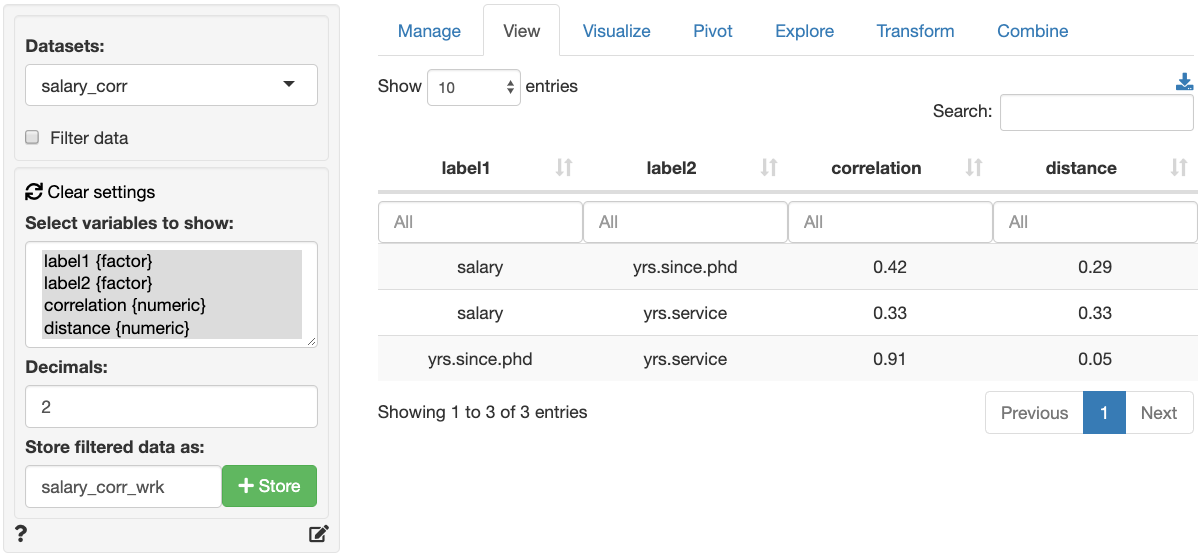
## Store as data.frame
The correlation matrix can be stored as a data.frame by (1) providing a name for the new data set and (2) clicking on the `Store` button. The new data sets will the estimated `correlation` for each variable pair and a `distance` measure that is calculated as follows: `distance = 0.5 * (1 - correlation)`. This measure will be equal to 1 when the correlation between two variable is equal to -1 and equal to 0 when the correlation between two variables is equal to 1. For an example of what such a dataset would look like, see the screenshot below of the _Data > View_ tab. Data sets with this structure can be used as input to create a (dis)similarity based map by using _Multivariate > (Dis)similarity_.
### Khan on correlation
### Report > Rmd
Add code to _Report > Rmd_ to (re)create the analysis by clicking the icon on the bottom left of your screen or by pressing `ALT-enter` on your keyboard.
By default the correlation plot samples 1,000 data points. To include all data points use `plot(result, n = -1)`
To add, for example, a title to the plot use `title(main = "Correlation plot\n\n")`. See the R graphics documentation for additional information.
### R-functions
For an overview of related R-functions used by Radiant to evaluate correlations see _Basics > Tables_.
The key function from the `psych` package used in the `correlation` tool is `corr.test`.