> Evaluate regression model performance
To download the table as a csv-files click the top download button on the right of your screen. To download the plots at a png file click the lower download icon on the right of your screen.
#### Response variable
The numeric outcome, or response, variable of interest.
#### Predictor
Select one or more variables that can be used to _predict_ the value of the response variable. This could be a variable or predicted values from a model (e.g., from a regression estimated using _Model > Linear regression (OLS)_ or a Neural Network estimated using _Model > Neural Network_).
#### Show results for
If a `filter` is active (e.g., set in the _Data > View_ tab) generate results for `All` data, `Training` data, `Test` data, or `Both` training and test data. If no filter is active calculations are applied to all data.
## Example
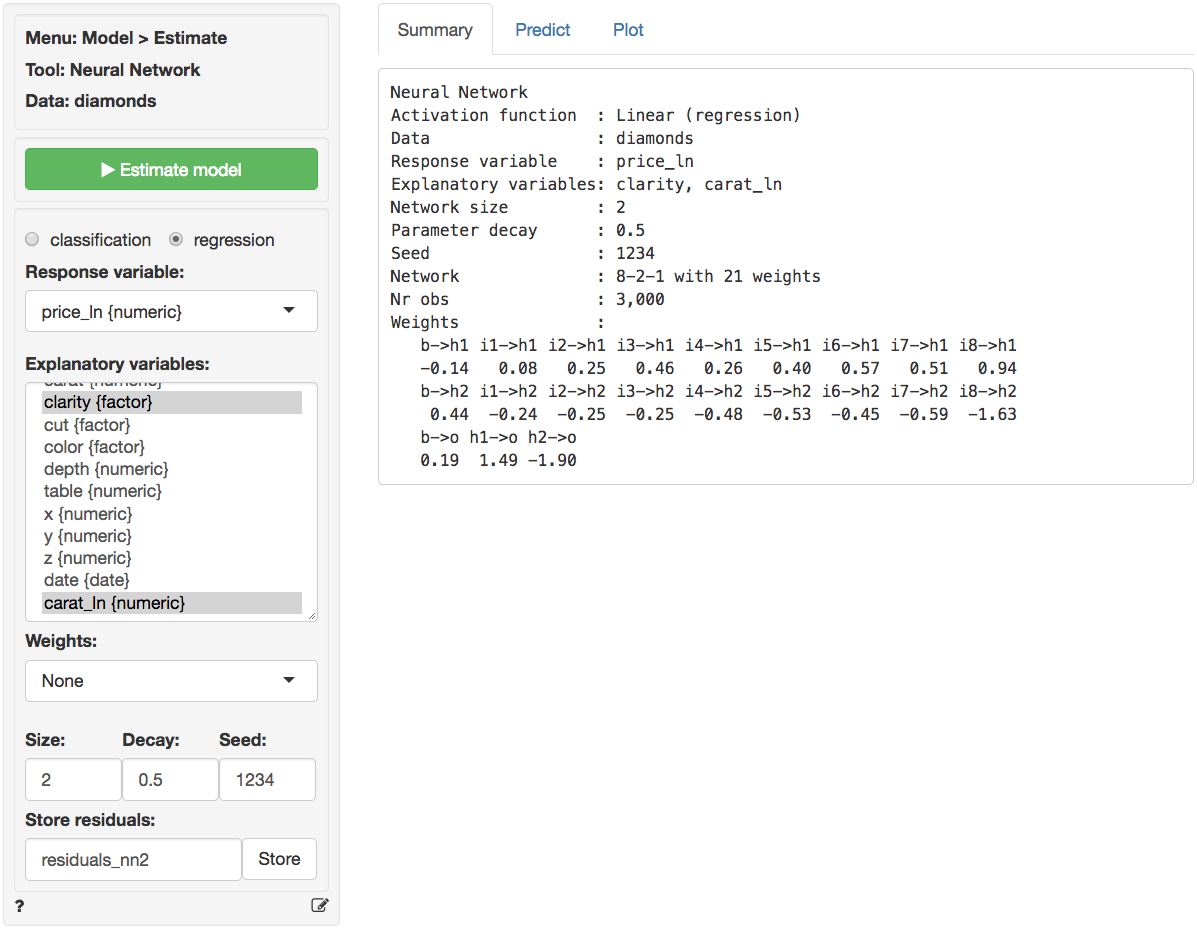
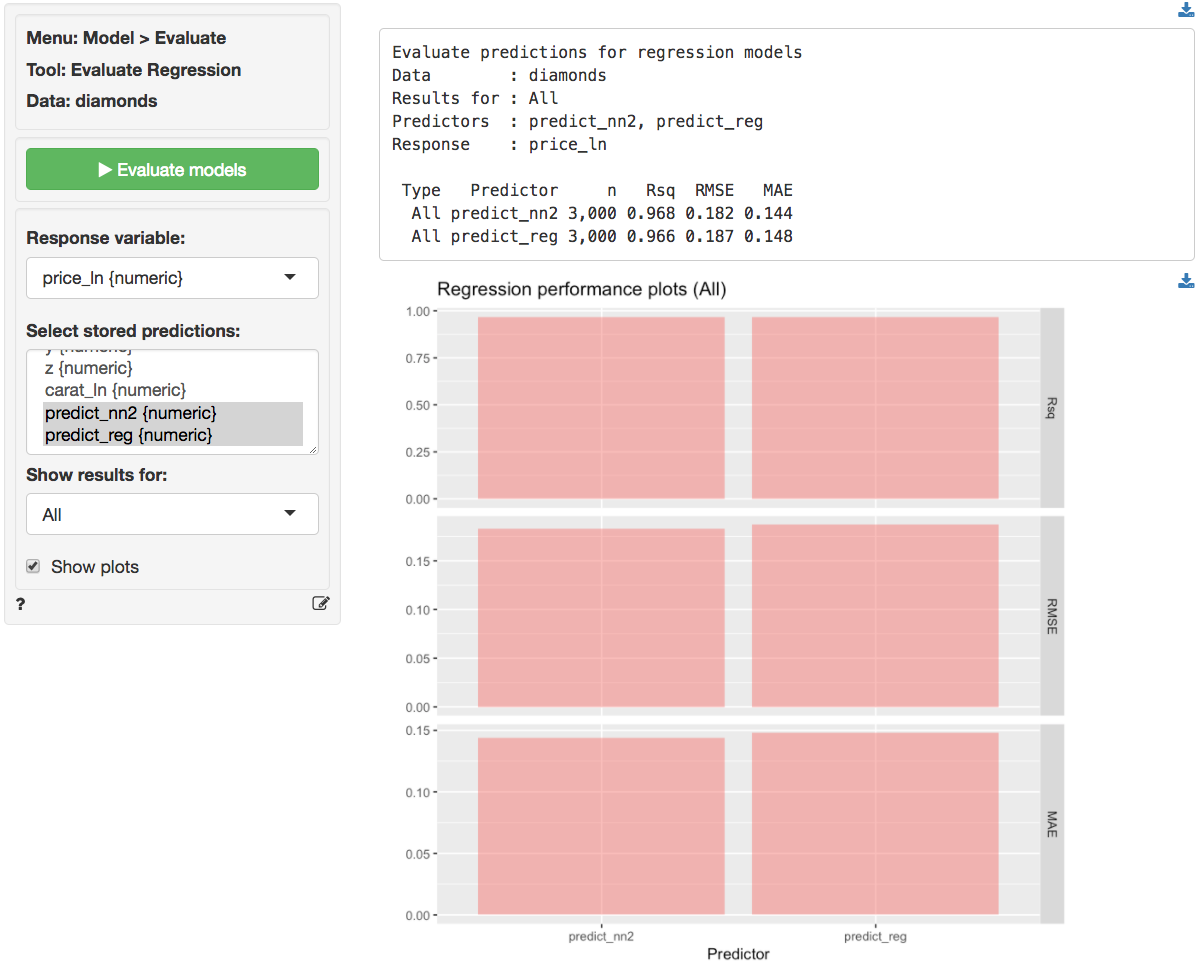
Predictions were derived from a linear regression and an neural network with two nodes in the hidden layer on the `diamonds` data. The variables `price` and `carat` were log-transformed prior to estimation.The data is available through the _Data > Manage_ tab (i.e., choose `Examples` from the `Load data of type` drop-down and press `Load`). The predictions shown below were generated in the _Predict_ tab.
The test statistics show a small, but consistent, advantage for the NN.
### Report > Rmd
Add code to _Report > Rmd_ to (re)create the analysis by clicking the icon on the bottom left of your screen or by pressing `ALT-enter` on your keyboard.
`Rsq`, `RSME`, and `MAE` are plotted by default. It is possible to customize the plotted results through _Report > Rmd_. To change the plot use, for example:
```r
plot(result, vars = "Rsq")
```
The plot can be further customized using `ggplot2` commands (see example below)). See _Data > Visualize_ for details.
```r
plot(result, vars = "Rsq") +
labs(caption = "Based on data from ...")
```
### R-functions
For an overview of related R-functions used by Radiant to evaluate regression models see _Model > Evaluate regression_